

MD&A · 2025
In this section4 topics
Overview of Operations
Overview of Operations
Delta Electronics Thailand concluded FY2025 with a strong performance, supported by continued revenue growth in 4Q25, a healthy margin profile, and disciplined cost management. Full-year revenue reached USD 6,025 million, representing a 30.9% year-on-year increase, while net profit grew 42.4% year-on-year to USD 754 million.
Operating Results & Financial Condition
Operating Results & Profitability
All the financial information discussed herein is for the fiscal year ending 31 December 2025, 2024, 2023 and has been prepared on consolidated basis.
Consolidated Financial Information | 2025 | 2024 | 2023 | |
Total Assets | million baht | 154,131 | 123,097 | 108,145 |
Total Liabilities | million baht | 57,404 | 43,155 | 40,606 |
Total Shareholders’ Equity | million baht | 96,727 | 79,942 | 67,539 |
Registered Capital | million baht | 1,259 | 1,259 | 1,259 |
Paid-up Capital | million baht | 1,247 | 1,247 | 1,247 |
Key Financial Ratios | ||||
Liquidity Ratios | ||||
Current Ratio | times | 1.98 | 2.03 | 2.07 |
Quick Ratio | times | 1.32 | 1.25 | 1.11 |
Cash Ratio | times | 0.54 | 0.85 | 0.38 |
Receivable Turnover | times | 5.03 | 4.98 | 4.77 |
Average Collection Period | days | 72 | 72 | 75 |
Inventory Turnover | times | 4.35 | 3.86 | 3.91 |
Average Inventory Turnover Period | days | 83 | 93 | 92 |
Account Payable Turnover | times | 4.30 | 4.42 | 4.56 |
Average Payment Period | days | 84 | 81 | 80 |
Cash Conversion Cycle | days | 70 | 84 | 89 |
Financial Data and Profitability Ratios | ||||
Sales Revenues | million baht | 198,154 | 164,733 | 146,371 |
% Change | (%) | 20.30% | 12.50% | 23.50% |
Gross Profit | million baht | 53,606 | 40,497 | 33,491 |
Gross Profit Margin | (%) | 27.05% | 24.58% | 22.88% |
Operating Expenses (including Research and Development) | million baht | 27,280 | 22,637 | 15,483 |
Operating Expenses (including Research and Development) to Sales | (%) | 13.77% | 13.74% | 10.58% |
Operating Profit Margin | (%) | 13.29% | 10.84% | 12.30% |
Other Income to Total Revenues | (%) | 1.38% | 1.20% | 1.21% |
Net Profit | million baht | 24,814 | 18,939 | 18,423 |
% Change of Net Profit | (%) | 31.02% | 2.80% | 20.06% |
Net Profit Margin | (%) | 12.52% | 11.50% | 12.59% |
Net Profit to Total Revenues | (%) | 12.34% | 11.36% | 12.43% |
Return on Equity | (%) | 28.09% | 25.68% | 30.15% |
Efficiency Ratios | ||||
Return on Assets | (%) | 17.90% | 16.38% | 18.50% |
Return on Fixed Assets | (%) | 49.57% | 75.82% | 87.60% |
Asset Turnover | times | 1.29 | 1.44 | 1.49 |
Financial Policy Ratios | ||||
Debt to Equity | times | 0.59 | 0.54 | 0.60 |
Interest Coverage | times | 153 | 225 | 139 |
Dividend Payout | (%) | 30.20% | 32.93% | 30.40% |
* Pending for approval from the 2026 annual shareholders’ meeting
Operating Results for the year 2025, 2024, and 2023 Unit: Baht million
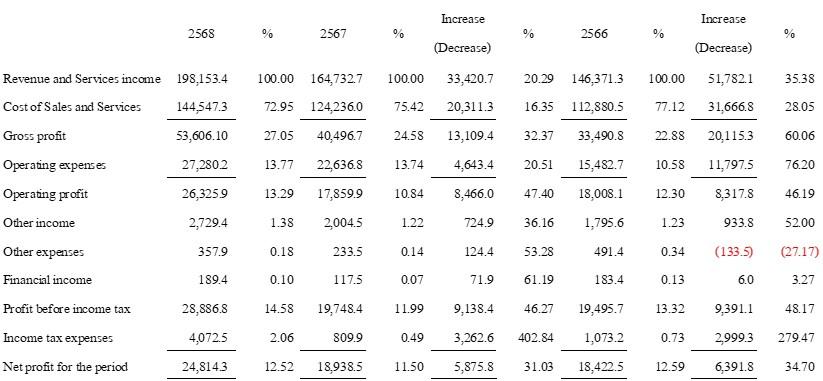
Breakdown of Sales Revenues by Business Group Unit: Baht million
Product Group | 2025 | 2024 | 2023 | |||
Revenue | % | Revenue | % | Revenue | % | |
Power Electronics Group | 125,832 | 63.50% | 89,445 | 54.30% | 78,167 | 53.40% |
Mobility Group (EV) | 33,383 | 16.85% | 44,774 | 27.20% | 42.123 | 28.80% |
Infrastructure Group | 33,434 | 16.87% | 26,191 | 15.90% | 22,105 | 15.10% |
Automation Group | 5,017 | 2.53% | 4,255 | 2.60% | 3,830 | 2.60% |
Others | 488 | 0.25% | 67 | 0.00% | 146 | 0.10% |
Total Sales Revenues | 198,154 | 100.00% | 164,732 | 100.00% | 146,371 | 100.00% |
Note
Power Electronics segment is a business segment which designs, manufactures, and sales of power supplies applied to computer, server, office automation equipment and household electric appliances.
Mobility segment (former was electric vehicle solution under power electronics segment) is a business segment which designs, manufactures, and sales of power supplies applied to e-Drive System and Power Electronics System in driving electric vehicle
Infrastructure segment is a business segment which designs, manufactures, and installations of information and communication technology infrastructure and energy system infrastructure. The main products are Telecommunication system, Renewable energy, Energy storage and High power etc.
Automation segment is a business segment which designs, manufactures, and installations of industrial and building automation. The main products are Machine automation, Industrial motion system, Smart sensor system and Lighting automation for building etc.
In 2025, consolidated sales revenues totaled 198,514 million baht, a rise of 20.3% and 35.4% from 2024 and 2023, respectively, primarily driven by a continued expansion of power electronics business following increased demand for data center energy management solutions. The uptrend aligns to capital expenditures (CAPEX) from major cloud service providers, who are continuously enhancing their artificial intelligence (AI) capabilities, in line with broad-based demand for AI applications.
Sales Revenues Breakdown by Geographic Location
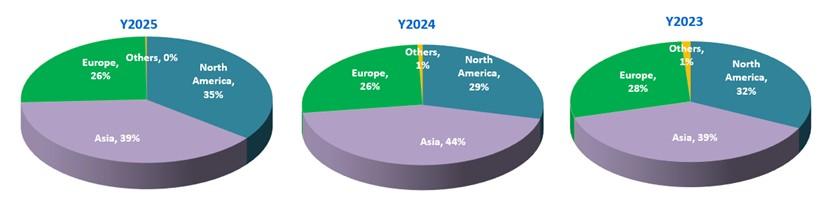
In 2025, sales revenues proportion in North America increased from 29% to 35%, on the other hand, the Asia market’s sales revenues proportion dropped from 44% to 39%. Revenue from the European market remained stable at 26%
Exchange Rate Impact
Foreign exchange posted a gain of 315 million baht in 2025, in comparison with a loss of 70 million baht in 2024. Throughout 2025, US dollar has depreciated significantly especially in the second half of the year based on market expectations of multiple interest rate cuts by FED in 2025. Nevertheless, the company implements a prudent hedging policy leading to a gain on exchange this year.
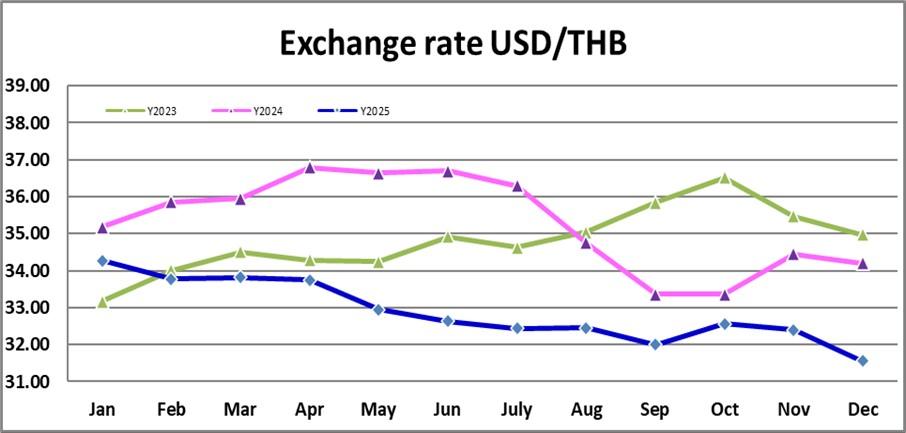
Source : Bank of Thailand
Cost of Sales and Expenses
Cost of Sales
In 2025, cost of sales accounted for 72.9% of total sales, compare to 75.4% and 77.1% for 2024 and 2023 respectively, In 2025 Gross profit margin posted an improvement Y-o-Y supported by a strong sales growth in healthy-margin products, especially the power electronics for custom designed data centers power system supporting intensive AI computing.
Selling and Administrative Expenses
Selling and administrative expenses (including research and development) in 2025, rose by 20.5% and 76.2% from 2024 and 2023, respectively due mainly to higher selling expenses from customs duties following the U.S. administration began imposing reciprocal tariff policies in 2025. The transaction gave rise to export duty expenses paid in advance by the Company on behalf of customers. Upon reimbursement by the customers, the amount would be recognized as revenue per the accounting principles. Besides, R&D expenses in 2025 increased in line with the strategy to expand regional innovation capabilities to support global customers.
Net Profit
The company’s Operating Profit in 2025 was 13.3%, compare to 10.8% and 12.3% in 2024 and 2023 respectively, based on an increase in gross profit with effective control of expenditure as mentioned earlier. Although the Company began recognizing a top-up tax expense of THB 3,438 million in 2025 following the implementation of the domestic top-up tax in Thailand to comply with the Global Minimum Tax (Pillar Two) rules, despite such tax factors, the Company was able to generate a Net Profit for the year 2025 at 12.5% or 24,814 million baht compare to 11.5% and 12.6% in 2024 and 2023, respectively. Earnings per share was 1.99 baht in 2025 compare to 1.58 baht in 2024 and 1.48 baht in 2023.
Assets and Liabilities
Assets
As at 31 December 2025, the company had total assets worth 154,131 million baht, an increase of 25.2% from 2024 and 42.5% from 2023. Return on assets was 17.9% in 2025 compared to 16.4% and 18.5% in 2024 and 2023, respectively. Some of the changes in key assets are summarized below.
Major assets and the changes in the assets are summarized as follows;
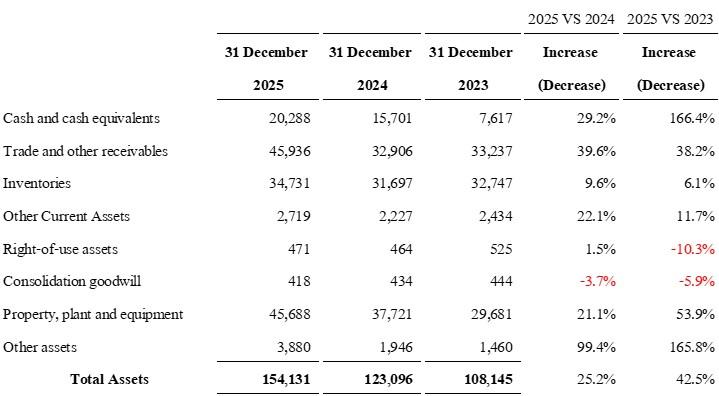
Breakdown of Assets in 2025, 2024 and 2023
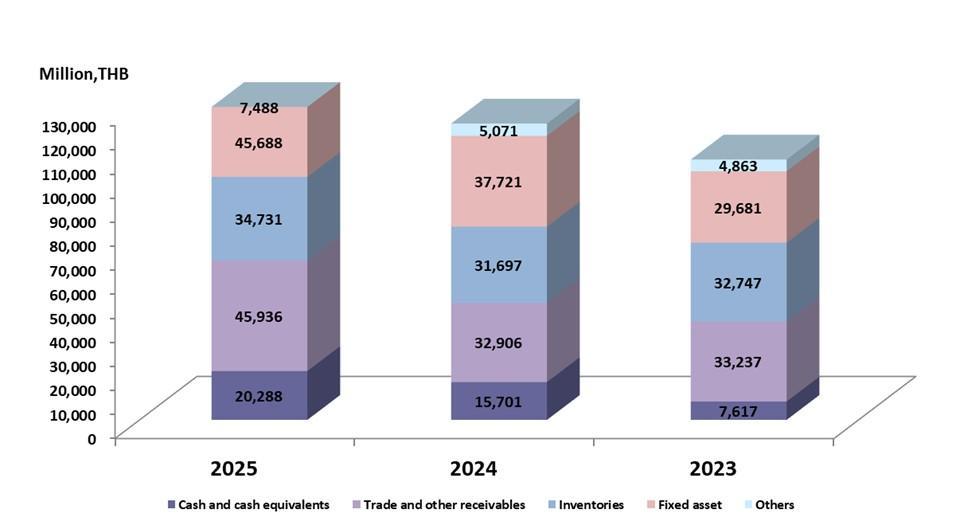
Cash and Bank Deposits as at 31 December 2025 amounted to 20,288 million baht, an increase of 29.2% and 166.4% from 2024 and 2023, respectivelydue to the Net cash flow from operating activitieshigher than Net cash flows in Investing activity in 2025
Net Trade Receivables as at 31 December 2025 stood at 45,936 million baht, an increase of 39.6% from 2024 and 38.2% from 2023, respectively, attributableto aremarkable increase in Sales Revenue.
Inventories as at 31 December 2025 totaled 34,731 million baht, an increase of 9.6% from 2024 and 6.1% from 2023, respectively, based on rising production output in the line with Sales Revenue growth.
Property, Plant and Equipment as at 31 December 2025 amounted to 45,688 million baht, an increase of 21.1% and 53.9% from 2024 and 2023, respectively following the investment in new factories in India and Thailand along with the capacity expansion in the current factories in Thailand.
Liabilities and Liquidity
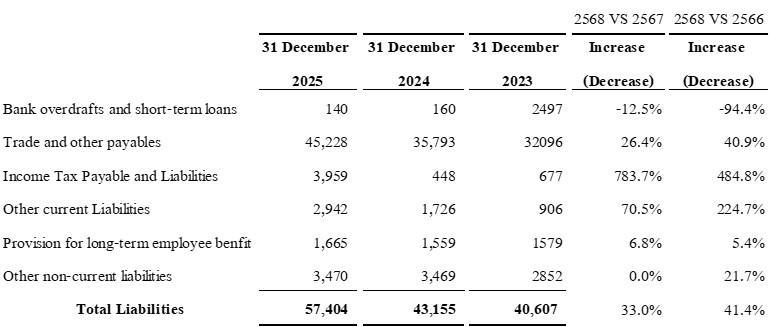
As at 31 December 2025, the company had total liabilities of 57,404 million baht, an increase of 33.0% and 41.4% from 2024 and 2023, respectively due to an increase in raw material purchases in line with higher production volumes, an additional provision for top-up tax, as well as new capital expenditure commitments in Thailand and India, respectively.
Breakdown of Major Liabilities
Return on Equity
As at 31 December 2025, shareholders' equity amounted to 96,727 million baht, a rise of 21.0% and 43.2% from 2024 and 2023, respectively. At the same time, returns on equity in 2025 stood at 28.1%, compared to 25.7% in 2024 and 30.2% in 2023 attributable to the net profit as mentioned above.
Debt Securities with Financial Ratio Requirements
Debt Securities with Financial Ratio Requirements Issued?
No
Factors That May Affect Financial Condition
Factors or Incidents That May Materially Affect Financial Condition
In 2025, Delta Electronics Thailand has reaffirmed its position at the forefront of the global transition toward sustainability and intelligent industry. Our milestones this year reflected a steadfast commitment to innovation and responsible growth. Against the backdrop of geopolitical tensions, global trade shifts, and elevated market volatility surrounding the technology sector, Delta maintained strong execution underpinned by a resilient supply chain strategy that effectively mitigated disruptions and sustained margin stability.
As we reflect beyond our financial achievements, we see a future-ready growth organization shaped by strategic partnerships, ongoing technological innovations, and an unwavering investment in the next generation of talent. In many ways, 2025 was a year of validated strategy and tangible actions.
Looking ahead to 2026, we propel the business forward whilst navigating constant change and dynamic challenges including product advances, changes in the supply ecosystem, the rapid shift in competitive landscape, and much more. As uncertainty and external risks persist in the global economy, we are cautiously optimistic in the technology sector outlook supported by structural tailwinds from infrastructure investment and scaled AI deployment. Key priorities will be primarily on operation excellence and strengthening local capabilities in a period of rapid expansion to meet customer demand in a structured and disciplined manners.